With residential mortgage rates again topping 7% this week, we thought it would be interesting to look at some key industry timeseries metrics, and those of a few originators to see how they are faring in this challenging lending environment. In this article we will look at production sold into Freddie and Fannie securitizations. Next week we will review some corresponding Ginnie Mae – related metrics
Since January 2021, the US has witnessed a rapid change in mortgage market metrics. 2021 saw the tail end of a powerful refinancing wave driven by historically low interest rates and strong housing values. The rapid succession of Fed rate increases beginning in the early months of 2022 forced the industry into an environment with very different characteristics – increased lending rates, larger loan balances and flat or decreasing housing values. In the following charts and paragraphs we will visually review the changes in some of the key loan features and changes in originations in different regions by the largest mortgage lenders throughout the January 2021 through April 2023 timeframe (“study period.”)
Origination Metrics Reviewed
With material rapid increases in loan rates, the aggregate monthly volume of new mortgages going into the Uniform Mortgage Backed Securities (UMBS) decreased by roughly 80% during the study period.
While all lenders suffered significant origination volume reductions, some fared better than others. For instance, as shown in the next chart, UMBS-related volume of each United Wholesale Mortgage and Penny Mac dropped by about 40%, while that of others dropped by up to about 90%, or more. Later charts will show some of the underlying factors.

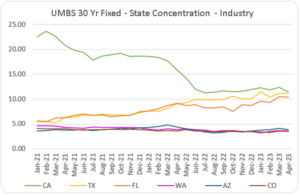
The next two charts show industry origination levels by state. The first shows those experiencing the greatest UMBS-related volume declines (exceeding 80%), the second shows those with the least volume declines (about 60%).

As would be expected, increasing rates led to a dramatic shift in the mix of new originations away from refinances to purchase money loans.

Interestingly home prices did not dramatically drop despite the rapid increase in rates. We will examine some differences by state later. In general, however, strong demand by first time homebuyers and those trading up kept an elevated floor under housing prices. Apparently, the societal shift towards working from home contributed to the need for more space, as did the increasing birth rates among Millennial households. The chart below shows how first-time homebuyers became a dominant force in the market.
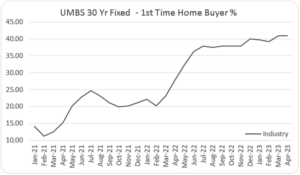
Not surprisingly, the strength of average LTV, FICO, DTI and other metrics observed in UMBS-related loan volume diminished somewhat as new homebuyers with less-developed credit histories and no prior home equity build-ups became the prominent market-driving group. For instance, the UMBS-related industry metrics changed during the study period as follows:
- 5% increase in average mortgage rate,
- $30 thousand increase in average loan balance,
- 6 point drop in average FICO score,
- 8% increase in average LTV ratio,
- 5% increase in DTI ratio,
- 27% increase in 1st time home buyer share,
- 22% increase in share of loans with mortgage insurance,
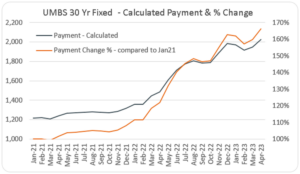
- 66% increase in new average loan payment,
The next chart shows the movements of average FICO scores and LTV ratios plotted against each other.
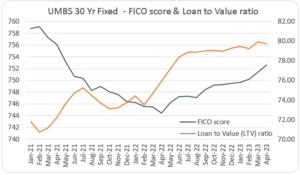
With the upward trend in LTV ratios, we also saw an increase in the percentage of loans with private mortgage insurance. Alongside increasing mortgage rates, property values and the share of first time home buyers, the change in DTI ratio during the study period has been upwards sloping as well.

With increasing LTVs, continued strong housing prices, and some increases in Fannie Mae and Freddie Mac (“GSE) maximum loan sizes average mortgage balances increased during the study period. The maximum loan sizes allowed by the GSEs is shown in the following table. Note, that GSE maximum loan amounts are up to 50% higher than shown in the table for Alaska, Hawaii, parts of California, and other high cost areas.

The combination of higher mortgage rates and greater average loan sizes contributed to significantly higher monthly payments for the new borrowers, as shown in the next chart.
Differences Observed Among States
Earlier we discussed the trend towards larger loans and the reasons. The pace of the loan balance increases and the size of the loan balances differ considerably from state to state.
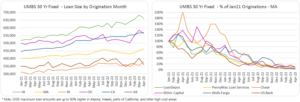
The following charts reflect changes in average loan size and origination volume by largest lenders, in the states with biggest declines in originations.

The lender origination volumes have declined across all states but the decreases have not been as steep in the states with lower average loan balances compared to the states with larger loan balances. The next chart displays the states with largest percentage increases in average loan balances.
Even among the largest lenders, the regions with highest production volumes often differed considerably. For some, California, even after substantial declines in new loan volumes, has remained the state with the largest origination share. For others, Florida and Texas have emerged as new loan production leaders.
The Berkshire Group is a management consulting firm that works with lenders, servicers, issuers, and others in the mortgage loan industry. We maintain proprietary databases and tools for pricing loans and MBS, performing loan file due diligence, evaluating portfolio performance, and scoring loans and MBS for likelihood of prepayment, delinquency, and default. Our clients use the tools for assisting in acquisitions, securitizations, portfolio management, evaluation of loss reserves and capital adequacy, loan buy-back claims, and litigation resolution.
Our agency and non-agency mortgage loan origination and performance databases allow us to monitor changes in loan origination characteristics, as well as analyze in detail the production and portfolios of specific lenders and servicers. Berkshire Group also tracks, analyzes, and incorporates within its pricing tools, historical home prices, unemployment statistics, interest rates, mortgage rates, property taxes, and property maintenance costs.

