Berkshire Group maintains databases tracking monthly originations and performance of both agency and non-agency mortgage loans. We also track industry and market metrics, and observe mortgage loan performance in relation to these metrics. We use these data and observations internally for analysis, and to support assumptions used in our valuation models.
Berkshire tracks individual loans related to the STACR; CAS; ACIS and CIRT credit risk transfer (CRT) programs. We also maintain and model CRT program transaction structures, waterfalls and cash flows analytics. The discussion herein includes discussion and charts derived from our data platforms.
As with other mortgage backed security products, CRT product prices vary with historical and expected changes in interest rates, voluntary prepayment speeds, delinquency and default levels, and loss severities. In this second of three discussions of CRT products, we will look at how CRT product prices have changed based on changes in the market environment.
In the first of Credit Risk Transfer (CRT) posts we provided an introduction to CRT transaction mechanics, structures and history of originations.
Market Environment
Since early 2020, healthcare and geopolitical events have moved many areas of the world into recession, while simultaneously leading to increased prices for consumer goods. Supply chains and manufacturing were disrupted, contributing to widespread shortages of products and increased costs for a wide variety of goods. Massive government COVID19-related aid programs, coupled with low interest rates contributed to increased consumer demand, and helped to escalate inflation in the U.S. to about 7%.
In 2022, the Federal Reserve (“Fed”) increased the federal funds rate seven times, for a total of 425 basis points, in an attempt to quell inflation. In response to Fed’s actions, mortgage loan rates increased in 2022 at the fastest rate since the early 1980’s. The Fed’s inflation-fighting actions seem to have slowed inflation, but may push the economy further into recession in 2023.
With higher rates on mortgage loans, mortgage loan refinance activity substantially declined, as did home sales and purchase-money mortgage loan origination activity.

Mortgage industry participants are trying to discern how existing mortgage loan performance and home prices will fare in the coming months. Some CRT bond traders and reinsurers are hoping to draw clues of expected performance, in part, by considering the similarities and differences in the 2004-2007 and 2019-2022 timeframes, and looking at what happened in 2008-2009 as a proxy for what could in happen in 2023 and 2024.
A COMPARISON OF TIMEFRAMES
Substantial differences exist between the 2004 – 2007 timeframe versus the 2019 – 2022 timeframe in terms of 1) industry participants, 2) products underwritten, 3) patterns of interest rates, 4) home replacement costs, and 5) other factors. Some similarities exist as well between the two timeframes. It is interesting to look at a few key metrics to see what pattern similarities may be present.
Interest Rates:
In the first set of graphs, we look at average 30-year fixed mortgage loan rate changes. The chart on the left shows monthly rate changes from January 2004 to December 2009. The chart on the right shows monthly rate changes from January 2019 to December 2022.
Clearly mortgage loan rates were substantially higher throughout 2004 – 2006 leading up to home price declines, than they were in the 2019 – 2022 timeframe. A rapid increase in mortgage loan rates was not the source of the housing market disruption in the earlier timeframe, as it has been in the current timeframe. Back then rates were consistently in the 5-6.5% range the entire time leading up to the market collapse. Instead, it was predominately credit issues (high LTV, stated income, etc.) that contributed most to the housing price declines. This time, it is more limited to increased housing payment issues.

Moving from historically low to significantly higher mortgage loan rates in the current cycle has led or will lead to:
1. Substantially fewer rate-term refinance opportunities;
2. Decreased housing affordability and pressure on home prices to decline;
3. Substantially fewer cash-out refi opportunities;
4. Much slower voluntary prepayments (lengthening duration);
5. Increased levels of delinquency;
6. Increased levels of default;
7. Longer timelines for sale of foreclosures;
8. Higher loss severities.
These factors combined have and will continue to put pressure on CRT investors and reinsurers, and CRT product price declines that we will discuss shortly reflect this pressure.
Home Prices:
The recent pace of home sales and the upward trajectory of home prices have only recently rolled over, so we may be early in a housing price decline cycle. If so, this is similar to the latter half of 2006 or early to mid-2007 timeframe. In the present cycle, a drop off in housing sales began in about April 2022, with housing price declines starting shortly thereafter. Looking forward, activity in mid-2007 to 2009 may provide some insights on what the market expects in 2023 and 2024
In the graphs shown below, we look at Home Price Index (HPI) changes. The chart on the left shows monthly HPI percentage change from January 2004 to December 2009. The chart on the right shows monthly HPI percentages changes from January 2021 to September 2022.
Notice the pattern similarity leading up to the period of decline. If the pattern continues, the rate of decline of home prices might be expected to accelerate in the coming months. However, the big question right now is “will the pattern continue?” The underlying factors were quite different.
The home price increases in the 2004 – 2006 timeframe were driven by a tidal wave of liquidity available to borrowers, arguably driven at least in part by an abundance of lenders offering low and no-doc loans with little or no equity requirements. Home prices trended well above the long-term trend lines, affordability was stretched, and eventually declining loan performance brought the house of cards down.
This time around, Fed-driven historically low interest rates and the COVID19-driven need for more living-space to work at home, gave a final “nudge” to a previously reluctant generation of Millennials to jump into the home-buying market. Combined with subdued construction, this surge in demand drove home prices up, financed with mortgage loans with rates that were as close to zero as we have ever seen them. Home prices increased about 40% from 2020 to mid-2022. Since then, a rapid increase in mortgage rates and the fears of recession have caused some correction in house prices. As mortgage rates stay elevated, demand for housing will be tempered, potentially resulting in home price declines continuing into next year.

Home Sales Activity:
The third set of graphs, shows the comparative ratios of houses for sale over the number of units sold in one month. This statistic provides an indication of how many months it would take for all the current homes for sale on the market to sell, given a monthly sales volume. A lower number means that buyers are dominating the market; a higher number means there are more sellers than buyers. Between the comparative charts the upward trends were similar. We have yet to see if a sustained drop-off in demand occurs this time around.

MBS Prices and Pass-Through Rates:
Now we will move away from comparison graphs and focus just on MBS interest rate and pricing trends in the current timeframe. The first graph below shows 30-year fixed rate UMBS prices by passthrough rate. The second graph shows the required UMBS passthrough rate required to achieve par value. The pricing trends clearly reflect reactions to materially increased market rates and slowing prepayments.

CRT Transaction Values:
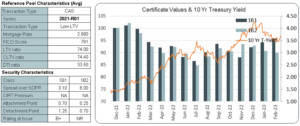
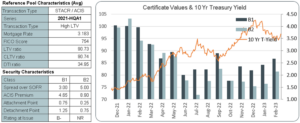
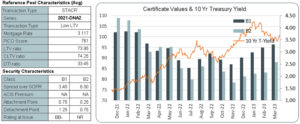
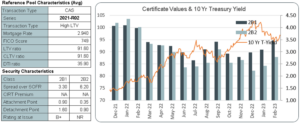
The final four graphs show values of offered tranches in two STACR and two CAS deals as compared to the 10-year Treasury yields. The first graph shows values for the B1 and B2 tranches of a high-LTV STACR deal (2021-HQA1). The second graph shows values for the B1 and B2 tranches of a low-LTV STACR deal (2021-DNA2). The third graph shows values for the 2B1 and 2B2 tranches of a high-LTV CAS deal (2021-R02). The fourth graph shows values for the 1B1 and 1B2 tranches of a low-LTV CAS deal (2021-R01).
The graphs show an inverse correlation of price to increased interest rates, and in some months in excess of what is explained by increases in Treasury rates alone. Spread widening has also occurred. We will more deeply explore the widening of spreads on the CRT products in Part 3 of 3 of our GSE Credit Risk Transfer (CRT) Product Discussion.
Higher-LTV STACR transaction
Lower-LTV STACR transaction
Higher-LTV CAS Transaction
Lower-LTV CAS Transaction
About The Berkshire Group
The Berkshire Group is a management consulting firm that works with lenders, servicers, securitizers, and others in the mortgage loan industry. We maintain proprietary databases and tools for pricing loans and MBS, performing loan file due diligence, evaluating portfolio performance, and scoring loans and MBS for likelihood of prepayment, delinquency, and default. Our clients use the tools for assisting in acquisitions, securitizations, portfolio management, evaluation of loss reserves and capital adequacy, loan buy-back claims, and litigation resolution.
Our agency and non-agency mortgage loan origination and performance databases allow us to monitor changes in loan origination characteristics, as well as analyze in detail the production and portfolios of specific lenders and servicers. Berkshire Group also tracks, analyzes, and incorporates within its pricing tools, historical home prices, unemployment statistics, interest rates, mortgage rates, property taxes, and property maintenance costs.

