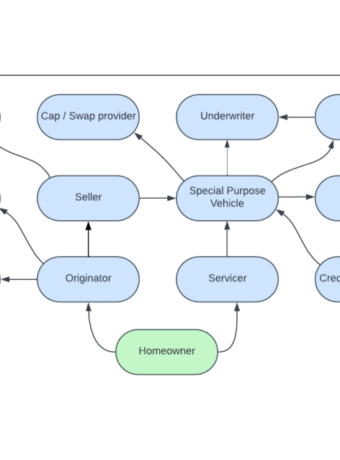
In the first two Credit Risk Transfer (CRT) posts we provided an introduction to CRT transaction mechanics, structures, past originations, economic environment and security pricing.
To conclude the series of CRT related posts we’ll review the latest trends in the economy, mortgage industry, and CRT securities pricing, and discuss some of the potential driving forces of CRT securities values.
Economic Environment
On average, home values have been declining for several months as mortgage rates have hovered at higher level than in the recent past. The monthly supply of new houses index, inflation rate, and federal funds rate are still at elevated levels. Opinions on the housing market outlook for the near future differ significantly among economists, with divergent views of the housing price changes in the coming months.


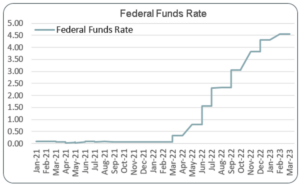
Much of the observed trends can be traced to the rapid increase in the Federal Funds Rate over the last year. The Federal Funds Rate is extremely important as it acts as the benchmark for lending institutions to set their product rates. Historically the Federal Funds Rate has been as high as in the low twenties and as low as reaching near zero. Currently it is at a moderate historic level, though quite elevated from where it had been for the prior thirteen years.
The Effective Federal Funds Rate is the rate set by the Federal Open Market Committee (FOMC) for banks to borrow funds overnight from each other. Bank clients deposit money at banks, the deposits provide banks with the funds necessary for offering loans to their customers. Regulators require banks to keep a certain portion of their capital in reserve, to help guarantee their stability and solvency. Banks often need to borrow funds from other banks overnight to meet regulators’ reserve requirements, or if they have more funds than necessary for the required reserve, they may choose to lend some to other banks. When the Federal Reserve raises the Federal Funds Rate, it is aiming to increase short term borrowing costs in the economy. This in return should decrease the supply of credit, make loans more expensive for everyone and decrease rising inflation by reducing the amount of money flowing through the economy. Below is a chart showing the trend in the Federal Funds Rate over the last two years.
Mortgage Performance
For the last few months, recent-vintage mortgage loans have experienced very low voluntary prepayments and delinquencies. Both measures are lower than at the height of COVID health crises, returning close to pre-pandemic levels. In the following charts we review voluntary prepayment speeds, delinquency rates, and modification levels on mortgages originated in years 2016-19 backing STACR and CAS transactions. Note that delinquency rates are inversely proportional to the increase in loan modifications, indicating a continued elevated use of modifications as a collection management tool.


CRT Securities Pricing
Before we look at CRT securities pricing, it is helpful to look at where passthrough UMBS have traded in the last two years. The two charts below respectively show pricing by pass-through rate, and required pass-through rate to trade at par. Here we see that MBS started dropping in price in about November 2021, with price drops accelerating through June 2022, with a slight bounce in June/July 2022, then a resumption of steep price declines into the October/November 2022 timeframe. MBS that traded well above par in 2021, and at par last January/February 2022, are now trading below par, but up from October/November 2022 lows. These MBS and are backed by mortgage loans with rates well below current market levels.

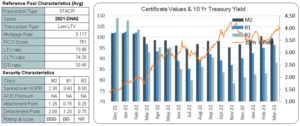
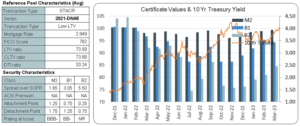
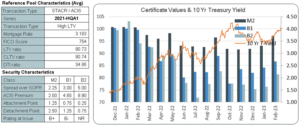
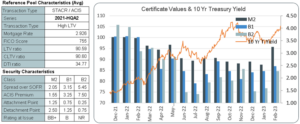
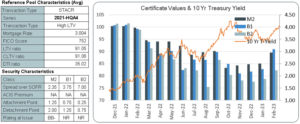
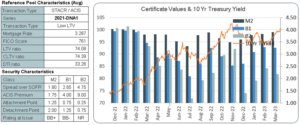
The six price-charts for CRT securities shown below likewise showed significant declines in 2022. The lowest-tranche CRT securities suffered the worst declines, as credit fears as well as rising market interest rates weighed heavily on them. The most-senior CRT securities have somewhat recovered their 2022 losses, while the most-subordinate CRT securities are still trading at substantially lower prices. Clearly both market rates and credit worries weigh on CRT securities, with lower home price trends raising increased loss severity fears as well.
We run various models to examine the covariate relationships of various economic and mortgage performance metrics and predicted CRT lowest-tranche security prices. For this article, we will limit the discussion to a few of the metrics that exhibit covariate relationships with CRT lowest-tranche securities pricing levels. Rather than getting into the statistical weeds (so to speak), we will just discuss a few market and performance metrics that exhibit a high correlation with CRT lowest-tranche securities pricing, and are good candidates to test as covariates for predicting CRT lowest-tranche securities pricing.
The following three rows of side-by-side charts show in the left column STACR lowest-tranche price levels for the last year, with corresponding values of three economic or performance metrics overlaid on the respective charts. The charts in the right-hand track the correlation coefficients of the security prices and the respective economic or performance metrics.
The three economic or performance metrics are 1) HPI Cumulative % Change since 2002, 2) Monthly Supply of New Houses, and 3) STACR 2021 Prepayment Speeds. Note that the correlation coefficient between the security prices and each of the first two (economic) metrics is about negative 0.8, a relatively strong negative correlation, and is about positive 0.8 between security prices and the third (performance) metric, prepayment speeds. With correlation coefficients, -1.0 indicates perfect negative correlation, 1.0 indicates perfect positive correlation, and 0 indicates no correlation. The closer to -1 or 1 the correlation coefficient is, the stronger the observed relationship.
The first-metric correlation suggests that an upward move in the HPI Cumulative Changes % is correlated with a downward move in CRT lowest-tranche securities pricing, and vice-versa. On the face of it, this seems counter-intuitive. Presumably, if home prices are increasing the risk of default is likely to decrease, as is the level of loss severities and losses-given-defaults. This suggests that the relationship we are seeing may be more complex or perhaps tied to a third or more variables.
The second-metric correlation suggests that an upward move in the Monthly Supply of New Homes is correlated with a downward move in CRT lowest-tranche securities pricing, and vice-versa. This relationship seems to make more sense, as greater housing supply may put downward pressure on existing home prices, which in turn may lead to an increased level of risk of defaults, and a higher level of loss severities and losses-given-default. Of course, a lot of new homes could also mean that the economy is booming and default risks are lower, so again the relationship is a bit more complex.
The third-metric correlation suggests than an upward move in prepayment speeds on the loans underlying the CRTs is correlated with an upward move of CRT lowest tranche security prices. This seems to make sense on its face. Presumably the magnitude of potential future losses goes down as fewer loans remain and the potential for further involuntary liquidations decreases.
The relationships are not clear cut. None of the metrics fully explains CRT lowest-tranche securities pricing, but each may have some predictive value and each may be a good covariate candidate for analysis. It is important to remember that correlation is not the same as causation. It only shows that a relationship appears to exist and deeper work is required in assessing each metric.
About The Berkshire Group
The Berkshire Group is a management consulting firm that works with lenders, servicers, issuers, and others in the mortgage loan industry. We maintain proprietary databases and tools for pricing loans and MBS, performing loan file due diligence, evaluating portfolio performance, and scoring loans and MBS for likelihood of prepayment, delinquency, and default. Our clients use the tools for assisting in acquisitions, securitizations, portfolio management, evaluation of loss reserves and capital adequacy, loan buy-back claims, and litigation resolution.
Our agency and non-agency mortgage loan origination and performance databases allow us to monitor changes in loan origination characteristics, as well as analyze in detail the production and portfolios of specific lenders and servicers. Berkshire Group also tracks, analyzes, and incorporates within its pricing tools, historical home prices, unemployment statistics, interest rates, mortgage rates, property taxes, and property maintenance costs.
Text content

