Recent Performance of 30 Yr. Fixed Rate Mortgages
Prepayment speeds on mortgages in UMBS securities from all reviewed origination years have varied greatly by vintage over the last 30 months. 2021 and 2022 vintage CPRs have been below 10% the entire time. Older vintages CPRs have been below 10% for six to twelve consecutive months, with newer vintages below 10% for more months.

The residential housing values have been marginally recovering for the last few months, but there is still uncertainty about the coming months:
- Interest rates are still at elevated levels and are expected to remain such for at least the near-term.
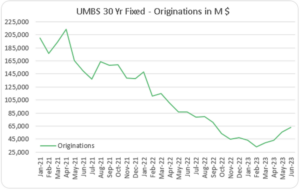
- UMBS origination volume has recovered slightly, but is still below the 10 year monthly average of $55.71 billion.
- Monthly supply of new houses ratio is still above the average.
- Allstate and State Farm, two of the largest property insurance companies, have stopped offering home insurance to new clients in California, Florida – states with the largest origination volumes in the recent years.

The monthly supply of new houses is the ratio of new houses for sale to new houses sold. The ratio provides an indication of the size of the new for-sale inventory in relation to the number of new houses currently being sold. The months’ supply indicates how long the current new for-sale inventory would last given the current sales rate if no additional new houses were built. The ratio has been declining for the recent months but it is still above last ten year average of 5.28 (years 2012-21). See Chart 1 below.
The twelve months percentage change in inflation has been decreasing for the last eleven consecutive months, but it still remains well above Federal Reserve target level. See Chart 2 below.
Chart 1. Chart 2.

Origination Patterns in UMBS 2021-23
Originations of 30 year Fixed rate mortgages in UMBS in millions
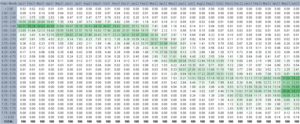
In the first months of 2021, we can observe a high concentration of new loans with rates in 2.50 – 3.00% range. In those months the vast majority of originations were rate refinances for the borrowers who had lived in the house and had already built up some equity, and presented low credit risk to lenders. To the contrary, the rates on new originations in the recent months have been in a higher and wider range of 5.50 – 7.50%. The majority of the new mortgages are for home purchase transactions, often involving time home-buyers. The loans have larger loan balances, and due to higher loan to value (LTV) ratios, the borrowers are often required to obtain mortgage insurance. Higher debt to income (DTI) ratios are another consequence of increasing loan balances. Lenders have to cover the higher variety of credit risks in the new originations with very different loan characteristics, by increasing mortgage rates for characteristics that are riskier than the norm.
Originations of 30 year Fixed rate mortgages in UMBS, percentage of total by mortgage rate
Pay-down of 30 year Fixed rate mortgages in UMBS in millions
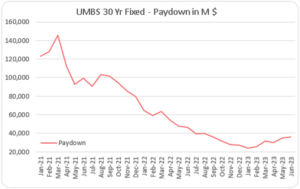
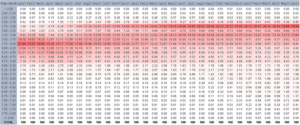
Two years ago, in the first half of 2021, the majority of pay-downs were concentrated in loans with higher-than-market-average mortgage rates, in 3.50 – 4.50% range. This was due to prepayments in full as current borrowers refinanced into lower rate loans. In the recent months, in our current higher rate environment, most of the pay-downs are taking place on mortgages with lower-than-average market mortgage rates, in 2.50 – 4.00% range. With a dearth of prepayments-in-full in the current higher rate environment, the paydowns are coming primarily from monthly payment amortization. It is not surprising that these are concentrated in lower rate loans, as most outstanding loans now are lower rate, and a larger portion of each payment is comprised of principal on these lower rate loans.
Pay-down of 30 year Fixed rate mortgages in UMBS, percentage of total by mortgage rate
Outstanding 30 year Fixed rate mortgages in UMBS in millions
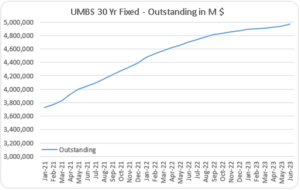
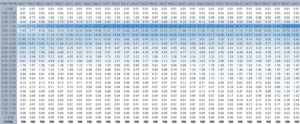
With a historically high volume of refinances in the 2021 -2022 lower-rate environment, the overall mortgage rate on outstanding mortgages decreased. The largest concentration of new loans in the first months of 2022 carried rates in 2.75 – 3.50% range. In February, 2022 the share of loans in the given range had increased to 56%. Since then, even with much lower origination volumes, has been steadily declining, to 47% in June, 2023 due to higher amortization through regular monthly payments occurring on these loans.
Outstanding 30 year Fixed rate mortgages in UMBS, percentage of total by mortgage rate
S-Curve patterns
In the following charts, we examine borrowers’ propensity to prepay depending on market rate changes relative to the rates on existing loans. The analysis was carried out using prepayment data in 2021-23 timeframe. Borrowers with loans originated in the extremely low interest rate environment from 2021-22, had less incentive to make prepayments as rates increased. Borrowers with loans from earlier origination years 2016-20 had relatively similar prepayment patterns depending on changes in market mortgage rates. Highest prepayment speeds were observed when market rates declined slightly more than 1% below existing rates on mortgages. Further decreases in the market rates did not provide additional incentive to prepay. See chart 3 below.
Borrowers’ propensity to prepay greatly varies depending on loan size. Loans with lower balances are prepaid less often for two primary reasons: 1) a decrease in monthly payment resulting from lower rates will not be as high as it would be on a larger loan balance; 2) recouping the refinancing costs might offset several months of savings with the new lower rate. To the contrary, refinancing costs on a larger balance loan are about the same, but lower new monthly payment would allow to offset refinancing costs in a single month. See chart 4 below.
Chart 3. Chart 4.
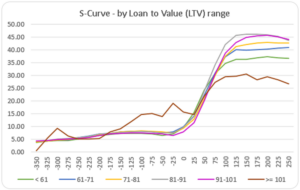
Loans with loan to value ratio above 100% are much harder to refinance, thus we see lower prepayment speeds even in environment with greatly lower market rates. See chart 5 below.
S-Curve by Loan to Value (LTV) ratio for 2016-22 origination years
Chart 5.
From the largest servicers reviewed, Rocket Companies moderately stands out with consistently highest prepayment speeds (See Chart 6.). This is the case even though the mortgage rate on new Rocket loans has been average among the largest lenders (See chart 7); not the lowest but, certainly, not the highest.
Chart 6. Chart 7.
As already observed in earlier Berkshire articles, volume and credit quality of new originations are inversely correlated with interest rates See chart 8.
With an increase in the proportion of first time home-buyers, coupled with rise in average loan balances, we observe a steady climb in the share of new loans with mortgage insurance, exceeding 43% in June, 2023. See chart 9.
Chart 8. Chart 9.
Similarly, the increase in the share of first time home-buyers, coupled with an increase in average new mortgage balances, has been correlated with a slow but steady climb in debt to income ratio. See chart 10. Although we are seeing higher Loan to Value ratios and lower FICO scores on the recent months’ loan originations, they are still in line with 2017-19 averages. See chart 11.
Chart 10. Chart 11.
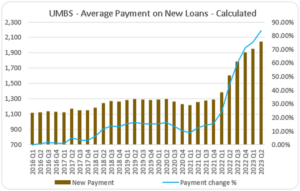
Higher loan balances, higher loan to value ratios, and higher interest rates have resulted into higher borrower monthly payments.
Calculated average payment on new loans in UMBS 30 Yr. Fixed rate transactions
About The Berkshire Group
The Berkshire Group is a management consulting firm that works with lenders, servicers, issuers, and others in the mortgage loan industry. We maintain proprietary databases and tools for pricing loans and MBS, performing loan file due diligence, evaluating portfolio performance, and scoring loans and MBS for likelihood of prepayment, delinquency, and default. Our clients use the tools for assisting in acquisitions, securitizations, portfolio management, evaluation of loss reserves and capital adequacy, loan buy-back claims, and litigation resolution.
Our agency and non-agency mortgage loan origination and performance databases allow us to monitor changes in loan origination characteristics, as well as analyze in detail the production and portfolios of specific lenders and servicers. Berkshire Group also tracks, analyzes, and incorporates within its pricing tools, historical home prices, unemployment statistics, interest rates, mortgage rates, property taxes, and property maintenance costs.


